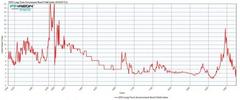
 With the world almost in total agreement that rates can only go up, that the 30-year bull market in rates is over and a return to "normal" rates is timely, perhaps a glance at the following chart of 700 years of government bond yields will enlighten a little as to where the anomalies and what the "normal" is. All too often investors are caught up in their *cognitive dissonance-driving recency bias when a bigger picture may just help* those who always proclaim to invest for the long-term.
Via Ralph Dillon of Global Financial Data,
It is fascinating to look at where we have been over the years and compare it to today’s markets. In looking at the data, you are trying to identify trends that will help you prepare for opportunities that the future holds. Sometimes you find similarities and sometimes you find differences with the data you are analyzing. That’s what makes it interesting. *What never changes, is the fact that for centuries Governments have issued debt and paid interest on that debt. *
How much interest they pay has certainly fluctuated throughout the years as demonstrated by the chart below.
*But what if we have a window that can peer into the past and see what interest rates have done not for 100 or 200 years, but for 700! *To do so, you just have to follow the changing center of financial power.
*Over the past eight centuries, the locus of economic power has gradually shifted from Italy to Spain to the Netherlands to Great Britain and currently to the United States. * The country at the center of the world’s power and economy issues bonds to cover expenses. Investors in that country and abroad purchase the bonds because they represent the safest bonds that are available for investment.
*The country at the center of economic power can issue more bonds at a lower cost because of the lower risk of the world’s economic center. * Over time, power ebbs away from that country and investors begin placing their money in the bonds of the new world economic power. Italy was the center of the western economic world until the 1500s.* Until then, the Mediterranean was the gateway to Byzantium, the Middle East, and through those countries, to India and China. *
*The Italian city-states of Venice, Genoa, Florence and others grew from this trade, but also fought wars against each other requiring funds for those wars.* By the 1600s, the nexus of economic power had shifted to the Netherlands as trade in the Atlantic and with northern Europe enabled the Dutch to strengthen their role in the global economy. The surplus of capital in the Netherlands is illustrated by the fact that Tulipmania, the world’s first bubble, which occurred in the *Netherlands in the 1630s. *
The Netherlands was too small to maintain its role as the center of the global economy for long, and the combination of trade, and commercial and industrial revolutions *moved the center of economic power to Great Britain at the end of the 1600s. *
*The Glorious Revolution of 1688 realigned political power in England* and put Britain on a sound economic footing that enabled it to remain the center of world economic and political power until 1914. After World War I, the center of economic power clearly shifted from London to New York and today, New York remains the center of the global economy. The Dollar is the world’s reserve currency, a fact that enables Washington to issue bonds at a lower cost than would otherwise be the case.
*Global Financial Data has put together an index of Government Bond yields that uses bonds from each of these centers of economic power over time to trace the course of interest rates over the past seven centuries. * From 1285 to 1600, Italian bonds are used. Data are available for the Prestiti of Venice from 1285 to 1303 and from 1408 to 1500 while data from 1304 to 1407 use the Consolidated Bonds of Genoa and the Juros of Italy from 1520 to 1598.
General Government Bonds from the Netherlands are used from 1606 to 1699. Yields from Britain are used from 1700 to 1914, using yields on Million Bank stock (which invested in government securities) from 1700 to 1728 and British Consols from 1729 to 1918. From 1919 to date, the yield on US 10-year bond is used.
*Below is a chart that reflects 700 years of Long Term Government Bond Yields to 1285*: Reported by Zero Hedge 9 hours ago.